
In this blog post, we’ll explore how measuring and monitoring metrics related to software testing environments can greatly benefit Value Stream Mapping (VSM) efforts. These metrics may encompass factors such as test coverage, defect density, and resource utilization.
By gathering and analyzing this data, organizations can enhance their testing processes, identify areas that require improvement, and ultimately deliver higher-quality software.
Moreover, we’ll provide examples of specific metrics to track, along with suggestions for tools that can be utilized to gather and analyze the relevant data.
What is VSM
Value Stream Mapping (VSM) is a lean manufacturing technique used to analyze and improve the flow of materials and information required to produce a product or service.
It is a visual tool that helps organizations to map out their current state of production, identify inefficiencies, and design a more efficient future state.
VSM is used across a variety of industries, including software development, to optimize processes and eliminate waste, ultimately improving productivity, quality, and customer satisfaction.
In software development, Value Stream Mapping (VSM) is used to analyze the flow of work from idea to delivery, identifying areas where delays, inefficiencies, and waste occur.
By mapping out the current state of software development and identifying areas for improvement, teams can optimize their workflows, reduce cycle times, and improve the overall quality of their software products.
VSM can help teams to focus on delivering value to customers by eliminating waste, improving communication, and streamlining processes.
This leads to faster delivery of high-quality software, increased customer satisfaction, and ultimately, a more successful software development process.
Metrics & VSM
Metrics support Value Stream Mapping (VSM) by providing valuable insights into the performance of various processes and activities involved in software testing.
By tracking metrics related to test coverage, defect density, resource utilization, and other factors, organizations can identify bottlenecks and inefficiencies in their testing processes and make data-driven decisions to optimize and streamline their workflows.
This, in turn, can lead to improved overall efficiency, reduced costs, and faster delivery of high-quality software products, all of which contribute to a successful VSM strategy.

TEM METRICS – Test Environment Metrics
Preamble: A key component of Test Environment Management is the ongoing measurement and optimization of your TEM practices. Below is a list of metrics that should be captured as part of establishing Test Environment Management capability.
Note: These are not exhaustive, capturing this information will set you on your way to implementing a successful TEM services organisation.
Test Environment Metrics:
Environment Coverage
- % of Test Environment Systems (Instances) under management (within CMDB)
- % of Test Environment Systems (Instances) with rich knowledge (IP) attached
Environment Usage
- Historical Usage of Test Environment Systems (Instances)
- Future (Planned) Usage of Test Environment Systems (Instances)
Environment Agility
- Time to Set Up an E2E Environment
- Time to Set Up Systems (Instances)
Environment Availability
- Availability of Environment
- Availability of Systems (Instances)
Operational Metrics – Change
- Number of System Changes
- Outage caused by a change
- % of Failed vs Successful Changes
- % of Tasks Automated vs Manual
Operational Metrics – Release
- Number of System Releases
- Outage caused by the release
- % of Failed vs Successful Releases
- % of Tasks Automated vs Manual
Operational Metrics – Data Refresh
- Number of System Data Refreshes
- Time to do a Data Refresh
- % of Failed vs Successful Data Refreshes
- % of Tasks Automated vs Manual
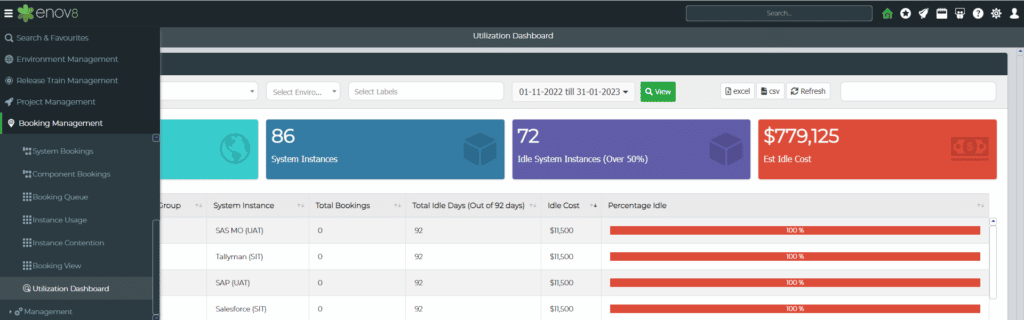
Enov8 Environment Manager, Utilization Metrics: Screenshot
Conclusion
In summary, Test Environment Metrics are crucial for building a successful Test Environment Management capability, which is an essential component of Value Stream Mapping (VSM).
Effective metrics offer valuable insights into the coverage, usage, agility, availability, and operational performance of the test environment.
By capturing and analyzing this data, organizations can optimize their test environment for maximum efficiency and reliability, thereby supporting their VSM efforts.
Next Steps – Enhance your IT Environment
Want to see how you can uplift your IT & Test Environment? Why not ask us about our IT & Test Environment Management solution?
A solution that helps you manage your Production & Non-Production Environments through System Modelling, Planning & Coordination, Booking & Contention Management, Service Support, Runsheeting, DevOps Automation, and centralized Status Accounting & Reporting.
Other TEM Reading
Interested in reading more about Test Environment Management. Why not start here:
Enov8 Blog: Your Essential Test Environment Management Checklist
Enov8 Blog: What makes a good Test Environment Manager
Enov8 Blog: Understanding the Types of Test Environments

Author Niall Crawford
Niall is the Co-Founder and CIO of Enov8. He has 25 years of experience working across the IT industry from Software Engineering, Architecture, IT & Test Environment Management, and Executive Leadership. Niall has worked with and advised many global organisations covering verticals like Banking, Defence, Telecom, and Information Technology Services