
Using metrics in value streams to align business and IT is a key component of successful DevOps implementation.
By measuring and tracking performance across the entire value stream, organizations can identify areas where IT and business processes are misaligned and identify ways to improve collaboration.
By monitoring and analyzing these metrics, organizations can gain insight into the performance and health of their value stream, and make adjustments to the process if necessary.
This ensures that the process is running at maximum efficiency, and that the organization is able to meet customer needs and expectations.
Furthermore, the insights gained from these metrics can be used to develop new processes that improve collaboration between IT and business, and ensure that the organization is better able to meet customer demands.

The Top DevOps Metrics
The DevOps movement has opened up a new world of opportunities for organizations of all sizes, allowing them to increase agility, streamline processes, and build better products faster.
But with this new world of possibilities comes a need to measure progress, success, and potential areas of improvement. With the right DevOps metrics, you can gain insight into the performance of your organization and identify areas for improvement.
Here are 17 DevOps metrics that we suggest matter most:
1. Lead Time measures the time from when work is started to when it is completed.
2. Deployment Frequency is the rate at which systems are deployed.
3. Speed of Deployment is the time it takes to deploy a system.
4. Deployment Rollbacks/Fails Frequency is the rate at which deployments fail or need to be rolled back.
5. Mean Time to Detect (MTTD) a Problem is the average time it takes to detect a problem.
6. Mean Time to Restore (MTTR) is the average time it takes to restore a system after a problem.
7. Change Failure Rate is the rate at which changes cause errors or failures.
8. Mean Time Between Failures (MTBF) is the average time between system failures.
9. Application Availability is the percentage of time a system is available to users.
10. Error Rate is the rate of errors in a system.
11. Throughput is the amount of work completed in a given time.
12. Cycle Time is the time it takes to complete a single task.
13. Traffic and Application Usage measure the amount of traffic and usage of an application.
14. Number of Tickets is the number of customer service tickets related to a system.
15. Commit Count is the number of commits made to a system’s codebase.
16. Number of Tests Conducted is the number of tests run to ensure the system’s quality.
17. Version Lead Time is the time it takes to complete a version of a system.
By tracking these essential DevOps metrics, you can gain insight into the performance of your organization and identify areas for improvement. With the right metrics, you can ensure that your organization is on the right track and continuously improving its processes.
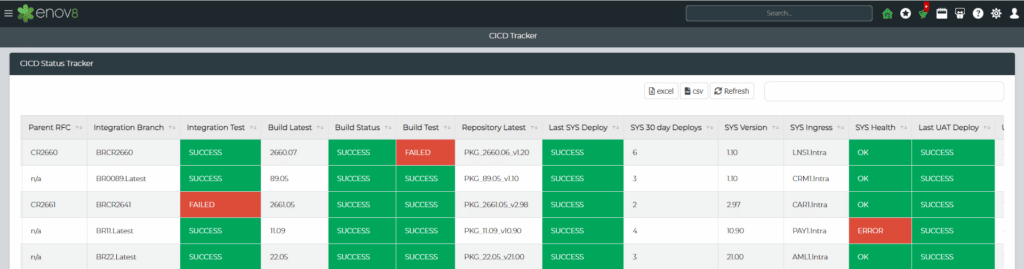
Enov8 CICD Information Wall, ‘Real Time Metrics’ for any occasion: Screenshot
These Top DevOps Metrics in Detail
1. Lead Time
Lead Time, also known as Cycle Time, is one of the most important measurements of DevOps success. It is the amount of time between when a request for a change is made and when it is successfully deployed to production.
Lead Time is an important metric for two reasons: it allows teams to measure their progress and identify areas for improvement, and it can help to ensure that resources are allocated efficiently and that changes are delivered on time.
By tracking Lead Time and other DevOps metrics, teams can identify areas where processes can be improved and become more efficient.
Additionally, Lead Time can be used to compare the performance of different teams or environments, allowing teams to identify best practices and improve their overall performance.
2. Deployment Frequency
Deployment frequency is an essential metric for measuring the effectiveness of a DevOps team. It measures the rate of successful deployments to production over a set period of time and is an indicator of how quickly the team can turn code into a working product.
A high deployment frequency implies that the team is able to quickly address customer needs and respond to feedback. A low deployment frequency indicates that the team may be stuck in the development phase, unable to get their code out into the hands of users.
By tracking deployment frequency, teams can ensure they’re pushing updates to production in a timely manner and delivering value to customers.
3. Speed of Deployment
Measuring the speed of deployment is one of the most important metrics for assessing the effectiveness of DevOps. Deployment speed is about how quickly changes can be deployed to production, so it can be used to verify the effectiveness of the DevOps process.
It is important to track the time from when the code is checked in to when it is running in production. This will help to identify any bottlenecks and areas of improvement that can be addressed to speed up the deployment process.
Additionally, tracking the time taken for the deployment to go through all of the stages of the deployment pipeline, such as development, testing, integration, and production, can provide valuable insight into how the process can be improved.
By monitoring the speed of deployment, DevOps teams can make sure that they are delivering features to their customers as quickly as possible.

4. Deployment Rollbacks / Fails Frequency
Deployment Rollbacks or Fails Frequency is an essential metric to consider when assessing the effectiveness of your DevOps process. This metric measures the number of times a deployment fails or needs to be rolled back after it has been initially deployed.
This can often be an indication of a larger issue with the development or deployment process, so it’s important to track this metric in order to identify any problems quickly and ensure that the deployment process is functioning properly.
Tracking this metric can also help to identify any potential areas for improvement in the development or deployment process, making it easier to address any issues quickly and ensure that deployments are running smoothly.
5. Mean Time to Detect (MTTD) a Problem
Mean Time to Detect (MTTD) is an important metric for measuring the performance of a DevOps team. It is a measure of the average time it takes for a team to detect when a system or application has become unhealthy, or when an incident or failure has occurred.
MTTD can be used to help identify areas where the team needs to improve their monitoring processes or alerting systems.
By tracking this metric, the DevOps team can quickly identify where potential problems lie and take the necessary steps to ensure the system remains healthy and running optimally.
MTTD is also a good measure of how quickly the team can respond to incidents or failures, and can help the team identify where processes need to be improved to ensure a rapid response to any potential issues.
6. Mean Time to Restore (MTTR)
Mean Time to Restore (MTTR) is a key DevOps metric that measures the average time it takes to restore a system service or application after it has gone down.
This metric is used to measure the efficiency of the system and the speed of the organization’s response in restoring the service.
The MTTR metric also helps organizations identify areas of improvement when it comes to restoring system services, as it provides insight into the amount of time it takes to restore a system, allowing them to better optimize the process.
By measuring the average time to restore system services, organizations can identify potential bottlenecks in their processes and better manage their systems.
The MTTR metric is an important metric for DevOps teams to track and understand, as it gives them an indication of how quickly they can restore services and applications, as well as how effective their processes are.
7. Change Failure Rate (CFR)
Change failure rate is a critical DevOps metric that measures the success rate of changes implemented in a system. It helps to identify areas in need of improvement, enabling teams to make necessary changes to ensure successful implementations.
The change failure rate is calculated by dividing the number of failed changes by the total number of changes implemented. This metric can be used to identify areas of risk and prioritize investments in process and technology improvements.
Additionally, it can be used to track the effectiveness of any changes implemented to increase the success rate of future changes.
By understanding the change failure rate, DevOps teams can make informed decisions on how to reduce the number of potential failures and improve the stability of their systems.
8. Mean Time Between Failures (MTBF)
Mean Time Between Failures (MTBF) is an important metric for DevOps teams to measure and track. It is an indicator of the reliability of a system, and tells us how often the system is expected to fail.
It is calculated by taking the total number of system failures over a given time period, and dividing it by the total number of hours of operation. The resulting figure tells us the average time between system failures.
MTBF is a critical metric for DevOps teams to monitor, as it can provide insight into the reliability of the system and help identify areas where improvements can be made.
Knowing the MTBF of a system can also help DevOps teams to plan for any potential downtime and plan for any maintenance or upgrades that may be necessary.
By monitoring MTBF, DevOps teams can ensure that their systems remain reliable and secure, and that any potential errors are caught early before they can cause significant disruption.
9. Application Availability
Application availability is a critical metric for DevOps teams to understand in order to ensure the success of their organization. It measures the amount of time a software application or service is available to users.
This metric is particularly important when services are hosted in the cloud, as downtime can cause significant delays and disruption to users.
Application availability can be measured in various ways, including the amount of time it takes for an application to respond to requests, the number of requests that fail, and the number of concurrent users.
By monitoring application availability, DevOps teams can ensure their applications are always running correctly and that users can access them with minimal disruption.
This can help increase customer satisfaction, reduce costs, and improve the overall efficiency of the organization.
10. Error Rate
Error rate is an essential DevOps metric that can help provide insight into the performance and reliability of applications and services. It is a measure of how often errors occur in the systems, services, and processes that DevOps teams manage.
Error rate is typically expressed as a percentage, with higher percentages indicating a higher rate of errors.
Error rate is an important metric as it can provide a quick indication of the overall health of the systems and services being monitored.
High error rates can signal problems in the underlying systems, and help teams quickly identify and diagnose issues. Additionally, error rate can be used to identify trends over time and the effectiveness of changes or improvements made to the systems.
By monitoring error rate, DevOps teams can identify and address issues before they lead to more serious problems, helping to ensure that their services meet the expectations of their users.
11. Throughput
Throughput is an important metric to measure when assessing the effectiveness of a DevOps process. Put simply, it is a measure of the amount of work that a system can process in a given period of time.
This can be measured in terms of the average number of tasks or features that are completed in a given hour, day, or month. It can also be measured in terms of the speed of tasks completed or the number of deployments that have been completed.
Throughput is a valuable metric to measure because it allows us to determine how efficient and effective the DevOps process is at completing tasks and features. By tracking throughput, we can identify areas of improvement and optimize our processes to increase efficiency.
12. Cycle Time
Cycle Time is an important metric for DevOps teams to understand and measure. It is the total amount of time it takes from when a task is initiated to when it is completed. This includes the entire development process, from the initial planning to the final deployment.
Cycle Time can help teams identify bottlenecks in the process and optimize the workflow for better efficiency. It’s also a great way to compare the performance of teams and identify areas for improvement.
DevOps teams should strive to reduce Cycle Time as much as possible to maximize productivity.
13. Traffic and Application Usage
The utilization of traffic and application usage metrics is essential for measuring the performance of DevOps initiatives.
By tracking the amount of traffic, requests, and errors that occur on a website or application, DevOps teams can quickly identify potential problems and take corrective action.
Additionally, traffic and application usage metrics can provide insights into usage patterns, user engagement, and customer experience.
By understanding the relationship between user requests and application errors, DevOps teams can develop strategies to reduce downtime and improve overall performance.
Furthermore, tracking usage metrics can help DevOps teams gain a greater understanding of user behavior and preferences, allowing them to optimize their products and services accordingly.
14. Number of Tickets
Monitoring the number of support tickets is an essential DevOps metric to track, as it provides insight into the quality and reliability of the services you are providing.
Tracking the number of tickets over time can help you identify when the number of tickets starts to increase, which could indicate a need for more resources, a bug in the system, or a change in user behavior.
Keeping an eye on the number of tickets can also alert you to any potential problems before they become too widespread, allowing you to take corrective action quickly and efficiently.
By monitoring the number of tickets coming in, you can gain a better understanding of how your services are performing, as well as identify areas for improvement.
15. Commit Count
Commit Count is one of the most important DevOps metrics for understanding the velocity of development and the health of your codebase.
Knowing how many commits are being made over a given period of time can give you a good indication of how productive your development team is and how quickly they are able to push out new features and fixes.
The number of commits can also be a great indicator of code quality, as more commits can mean more chances for bugs and code issues to be identified and corrected before going live.
Knowing your commit count can help you measure the progress of your development team and ensure that they are meeting the standards you have set.
16. Number of Tests Conducted
In order to measure the effectiveness of a DevOps environment, the number of tests conducted is an essential metric for understanding the stability and reliability of an application.
These tests are used to determine the quality of the code, evaluate the system’s performance, and identify areas of improvement.
Additionally, tests can provide insights into the development process, giving developers and engineers a better understanding of where time and resources should be spent.
The number of tests conducted is a valuable metric in monitoring the progress of the DevOps environment, as it tracks the frequency of development fixes and the ultimate stability of the application.
17. Version Lead Time
One of our favorite metrics in DevOps is Version Lead Time (VLT). VLT measures the total time it takes to move a development version to a release version. It includes the time needed for development, testing, and deployment.
This metric is incredibly useful for gauging the efficiency of a development team, as it helps to identify areas where processes can be improved. Additionally, it is a great way to measure the amount of time it takes for a development team to identify and address issues in the software.
By tracking VLT, development teams can identify areas where they need to focus their efforts in order to have a shorter release cycle. This can significantly reduce the amount of time that it takes for a product to move from development to release.
DevOps Metrics: How to Get Started
Measuring DevOps metrics can be a daunting task for many teams, but it doesn’t have to be. With the right approach, you can start gathering and understanding metrics quickly and easily.
The key is to identify the most important metrics for your team and then create systems to collect and analyze them.
Start by understanding what metrics are most relevant to your team and the work they do. Consider metrics such as lead time, deployment frequency, mean time to recovery, and change failure rate.
Also look at how your team is currently operating and identify areas where metrics can be used to measure and improve their performance.
Next, set up a system to collect the data associated with these metrics. This can be done in-house or through a third-party provider. Collecting the data will allow you to measure, analyze, and visualize the results, which can be used to identify areas for improvement.
Finally, create a plan for using the metrics to inform decisions and guide the team’s development processes. This might include changes to systems, processes, or approaches, or the introduction of new metrics.
Following these steps will help you get started measuring DevOps metrics and will ensure that your team is making informed decisions based on data-driven insights.
How to Measure Your DevOps Performance
Measuring the performance of your DevOps initiatives is essential to understanding the success of your organization’s efforts.
It’s important to have an accurate understanding of how the changes you make to your development and operations processes are impacting the overall performance of your systems.
By collecting and monitoring metrics, you can identify areas that need improvement, as well as areas of success. In this section, we’ll discuss the various metrics you should be measuring in order to evaluate your DevOps performance and determine if any changes need to be made.
One of the most important metrics to measure is the speed of delivery, which measures the time it takes for a feature to go from development to production. This metric is especially important for agile teams that need to quickly ship features in order to stay competitive.
You should also be tracking the number of bugs and issues that are reported, as well as the time it takes to address them. This metric can help you identify areas of your code or process that need to be improved in order to reduce the amount of bugs and issues.
Another key metric to track is the velocity of deployment, which measures the number of changes that can be deployed in a given period of time. This metric can help you determine the effectiveness of your deployment process and identify areas that need to be improved.
Additionally, you should be tracking the number of deployments that are successful versus the number that fail. This metric can help you determine if there are any areas of your process that are causing issues and need to be addressed.
Finally, you should also be monitoring the number of customer complaints and the time it takes to address them. This metric can help you identify areas of your customer experience that need improvement, as well as areas where you’re excelling.
By monitoring and measuring these key DevOps metrics, you can ensure that your organization is on track to achieve its goals.
Who Benefits from DevOps Metrics?
DevOps metrics are beneficial to many different stakeholders in the software development and operations life cycle.
Business executives, product owners, developers, operations teams, and quality assurance teams can all leverage DevOps metrics to better inform their decision-making and optimize the performance of their systems.
Business executives can use DevOps metrics to stay informed on the performance of their software and make decisions on how to best invest their resources.
Product owners, responsible for overarching Product Lifecycle Management (PLM), can use DevOps metrics to gain insight into the performance and effectiveness of their products.
Developers can use DevOps metrics to understand the impact of their code on the overall system. Operations teams can use DevOps metrics to monitor and optimize the performance of their systems.
Finally, quality assurance teams can use DevOps metrics to track the quality of the software being released.
By leveraging DevOps metrics, all stakeholders can have a better understanding of the performance of their software systems, leading to improved overall system performance.
Conclusion
In conclusion, leveraging DevOps metrics is a great way to bridge the gap between business and IT. By creating a standardized system of metrics to measure success, organizations can gain insight into their operations and use that data to make more informed decisions.
Furthermore, using DevOps metrics can help organizations to improve communication, collaboration, and transparency between the business and IT departments.
Ultimately, leveraging DevOps metrics can help organizations to be more efficient and effective in achieving their objectives.
Other Reading
Like what you read on metrics today, here are a few more.
Enov8 Blog: Benchmarking Release Management
Enov8 Blog: Test Environment Metrics
Enov8 Blog: Top 5 Test Data Management Metrics
Enov8 Blog: Top 5 Deployment Metrics

Author Jane Temov
Jane Temov is an IT Environments Evangelist at Enov8, specializing in IT and Test Environment Management, Test Data Management, Data Security, Disaster Recovery, Release Management, Service Resilience, Configuration Management, DevOps, and Infrastructure/Cloud Migration. Jane is passionate about helping organizations optimize their IT environments for maximum efficiency.